There are two names that stand above all others in the Business Intelligence Business. They are Bill Inmon and Dr. Ralph Kimball. Both have contributed greatly to our industry. Our industry is richer for their efforts of over 30 years.
I recently had the opportunity to meet Bill Inmon face to face at the very successful conference we sponsored here in New York City. You can read about that conference on this link. Bill was generous enough to take a look at Meta5 and he was suitably impressed.
Dr. Ralph Kimball was one of the co-founders of Metaphor Computer Systems that produced the early versions of the Meta5 product. Naturally, with Dr. Kimballs involvement it was decided very early on that the databases that Metaphor would design would be “star schema” databases. Further, it was decided that some of the query tools would be tightly linked with the idea of processing dimensional models.
Here is an example Start Schema from a very simple demonstration database.
As you can see there is a central “fact” table that contains the sales data. There are surrounding “dimension” tables that contains the textual information that describes the facts in the fact table. Way back when the Meta5 product was purchased by IBM this method of building data warehouses was “revolutionary” and there was great resistance towards it. It was only through the great work of Dr. Ralph Kimball and many others that the concepts of structuring data as a star schema were accepted. So in those early days it was often IT who said “no” to using Meta5 because they refused to believe that “star schemas” was a viable way to build their data warehouse.
Twenty years later “star schema” or “dimensional modelling” is considered the defacto standard way of presenting the data to you, the Power Data Analysts. IT has, for all intents and purposes, embraced dimensional models as being needed at the end user layer for you to access your data. Of course, other ways of storing data exist and there is still great debate among IT people about how to store data in your data warehouse. But there is now no argument that the end user delivery of your data should be in some form of dimensional model. It took nearly 20 years for IT people to finally get over that argument, but the argument is now settled.
Dr. Ralph Kimball has now sold over 400,000 copies of his book “The Data Warehouse Toolkit”. It has been one of the most popular books about data warehousing. With that many copies of his book in circulation it is very likely that you will have a star schema presentation layer in your data warehouse. Some times the dimensional model is implemented in proprietary databases like Microsoft’s Application Services product. Sometimes it is implemented in a relational database making it available to all tools.
This blog entry is about why Meta5 is the best BI product for Star Schemas that are stored in relational databases. Given that the tools were designed by the man who invented star schemas in the first place, Dr. Ralph Kimball, you can rest assured that we are the original, and the best, when it comes to querying star schema databases.
The Workstation Tools Data Dictionary (WTDD)
When your IT department create a “star schema” data warehouse they have to tell Meta5 which tables are dimension tables and which tables are fact tables. They also have to tell Meta5 about other technical details that you do not need to be worried about. Simply put. The WTDD provides a simple translation between the database you are using as your data warehouse and the Meta5 tools you are using. This is necessary because not all databases are the same. So there needs to be some special software in Meta5 to account for the differences in the databases that are used.
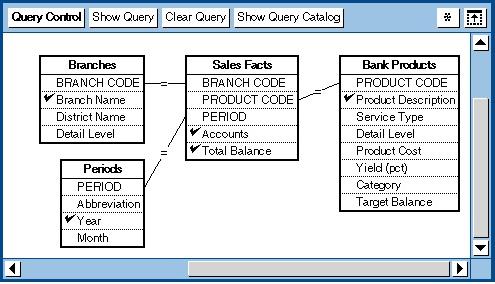
Here are a series of pictures that shows you a little bit about one small portion of our banking demonstration database.
As you can see there is a central sales facts fact table. It is surrounded by dimension tables for period, products, and branches. It is about as simple as you can get when creating an example star schema. We will show you how powerful the reporter tool is when it is used to query star schemas like this.
The DBA tool is how your database administrator tells Meta5 the technical details of your data warehouse.
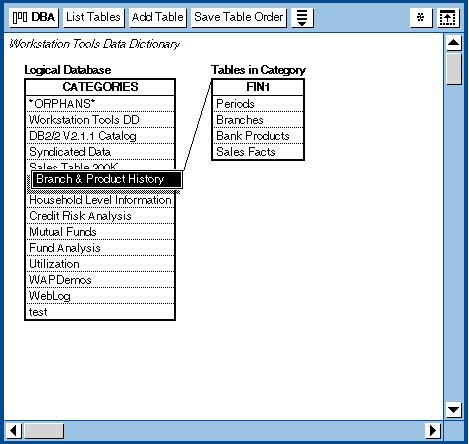
Above you can see that the DBA tool has placed the 4 tables into a category called “Branch and Product History”. This is a way of grouping tables together that are related and that you want to be able to put into the same query or same report. Categories are created so that you are not overwhelmed with too many tables in any single one category. The same table can be defined to be in many categories.
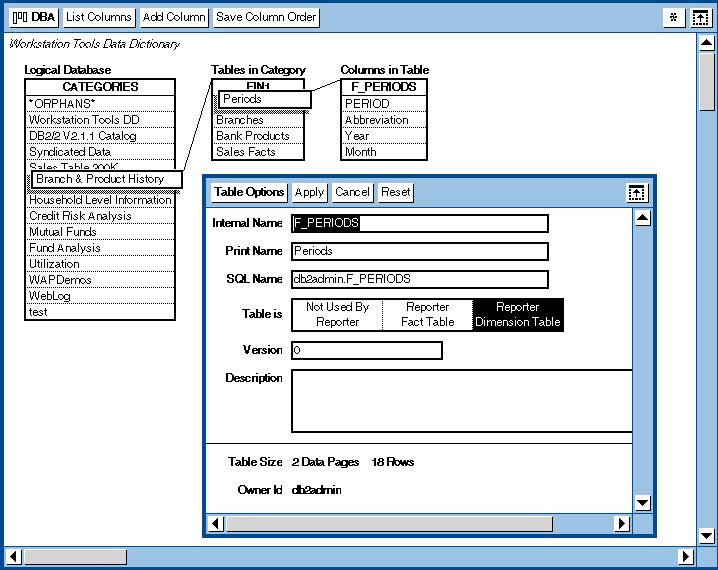
In the above image you can see that the DBA has told Meta5 that the physical table called F_PERIODS is to be presented to you as “Periods”. The column names and data types have also been set. And you can see it is defined to be a “Reporter Dimension Table”. When you open a Reporter Tool with this category defined the Reporter Tool will immediately know to put the tables in to the dimension table area.
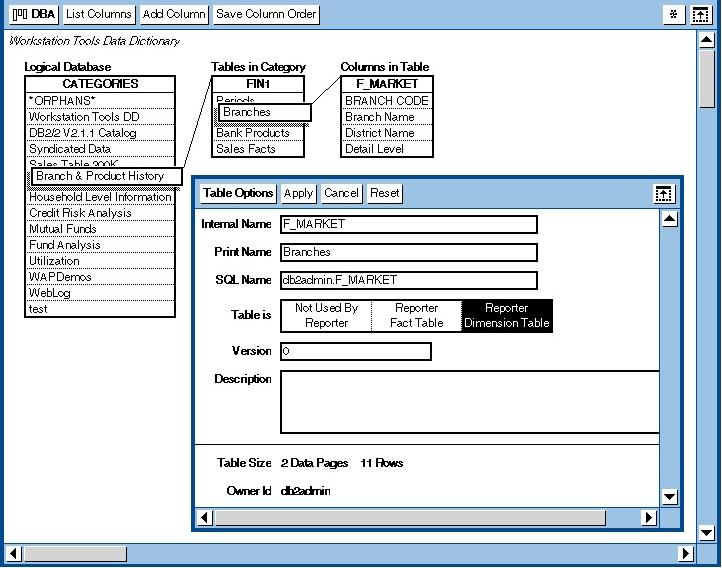
In the above image you can see that the DBA has told Meta5 that the physical table called F_MARKETS is to be presented to you as “Branches”. Notice it is also marked as a “Reporter Dimension Table”.
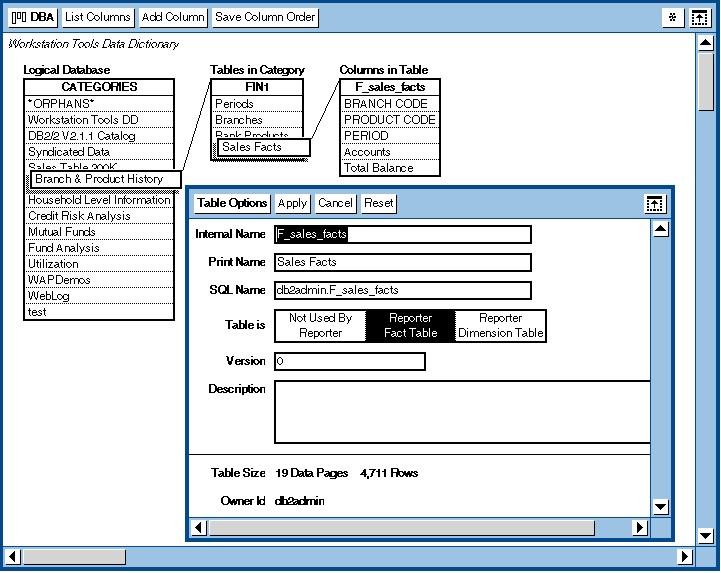
In the above image you can see that the DBA has told Meta5 that the physical table called F_SALES_FACTS is to be presented to you as “Sales Facts”. Notice it is marked as a “Reporter Fact Table”.
If you can believe this? The first versions of this reporter tool were available to Power Data Analysts just like you as long ago as 1990. Long before most people had ever heard of “star schemas” or “data warehouses” we were building them for our clients! Of course, over the years the tools have had features added to them. This is what I would like to show you next.
The Reporter Tool
The reporter tool is the most sophisticated data extraction and reporting tool in the Meta5 toolkit. This tool alone can build a very wide variety of reports that are numerically based. Of course the data from a reporter tool can be sent to Excel so that charts can be created. This blog entry will cover just a small percentage of what is available in the Reporter Tool. If you would like a demonstration or even to browse over the manual you can contact sales@meta5.com for more information.
Two of the most common reports that have to be produced by all organizations are:
- Year To Date this year versus Year To Date for the same period last year.
- Plan versus Actual for this year to date.
No companies can be managed properly without many measures across these two types of reports. It does not matter what you are counting, we are sure that you are counting them this year versus last year and where you have a plan you are counting them this year versus the plan. These are two of the most common reports.
So let us look at how this sort of report is built in the Reporter Tool to give you an idea why the tool is so perfect and powerful for accessing a star schema. This will build on many of the ideas you have seen in previous blog entries.
Firstly, we will show you the finished report. Or at least part of it due to the width of the screen.
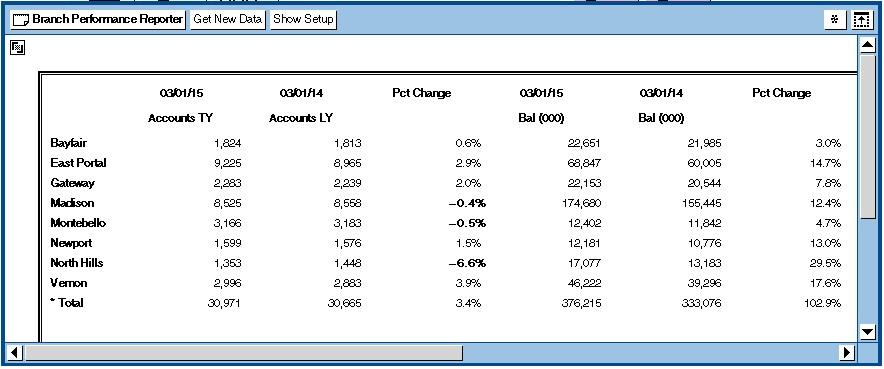
As you can see in the report there are bank accounts and balances that report current year to date versus last year to date along with the percentage change. This is as standard a report as you will see for your company.
We can only fit so much on the screen, so if you would like to browse the full width report please click on this link.
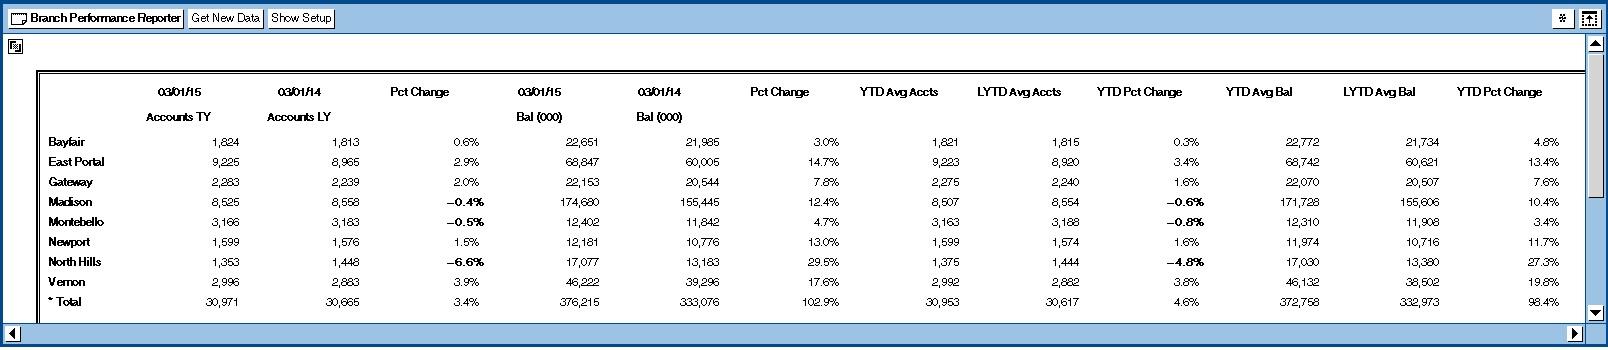
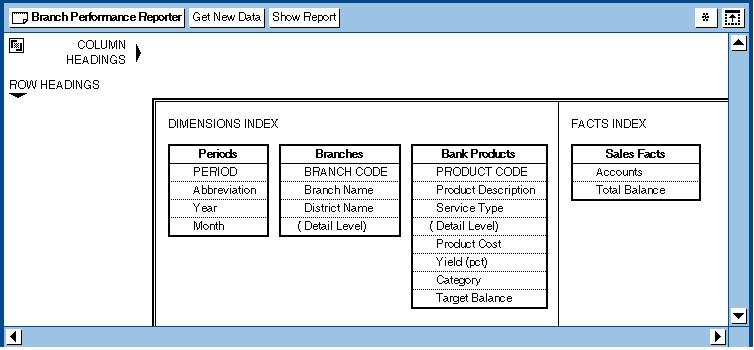
In the picture above you can see that the reporter tool presents you with the dimensions and the facts that it can access according to the Category that is provided by a parameter to the tool. Your DBA will have set up your categories for you.
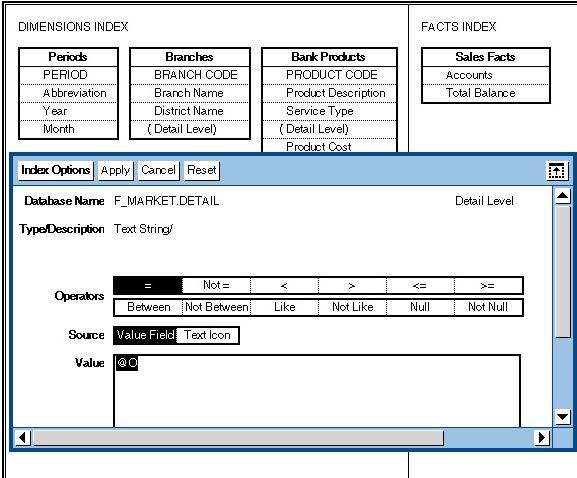
In the above image you can see () characters around the field that is called “Detail Level”. This field denotes the level data in the dimension table that will be accessed. When you press “options” using the function pad you can see that this field is constrained to be set to the variable @O. We have mentioned @ variables in a previous blog entry.
To create a report you drag and drop fields from the dimensions and facts area, apply options to them, and format them. We will now look at the finished report for this report and highlight some of the features of the report. To make it simple to understand we will first look at the Branch row header.
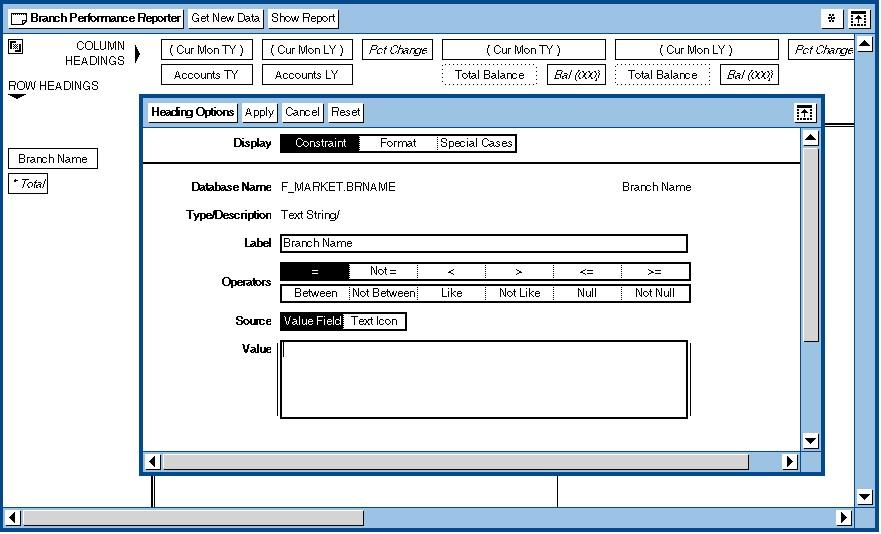
As you can see the field name from the database is F_MARKET.BRNAME and this is called “Branch Name” on the report. Notice there are no constraints so all branches will be selected.
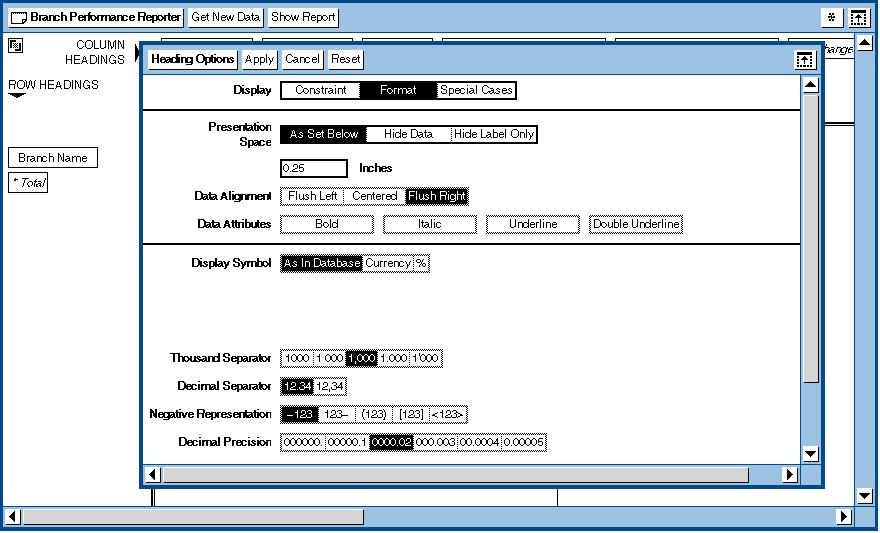
In the above picture you can see that there are formatting options for every field that is retrieved or calculated in the reporter tool. In this case there is little formatting for the branch name as the reporter tool is passing data back to the Text tool in order to write the finished report in this case.
Now we will show you 5 images of the fields that have been optioned and explain them as we go along. What you are seeing is how the fields Current Month This Year, Current Month Last Year, Accounts This Year, Accounts Last Year and the Percentage Change on Accounts from Last Year to this Year are created and presented on the report.
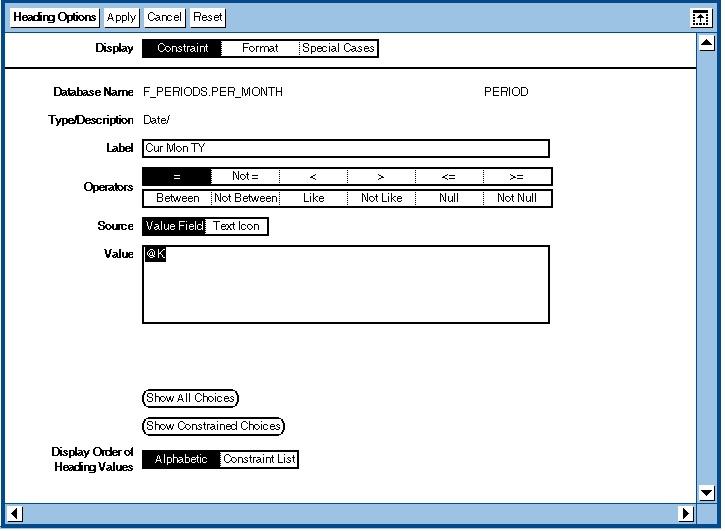
The first image shows how the Period, meaning month, for this year will be constrained. It will be set to the “@K” variable which is set in the data entry icon that is used to run the capsule. This variable is passed to the Reporter tool so that it knows which month of data to retrieve.
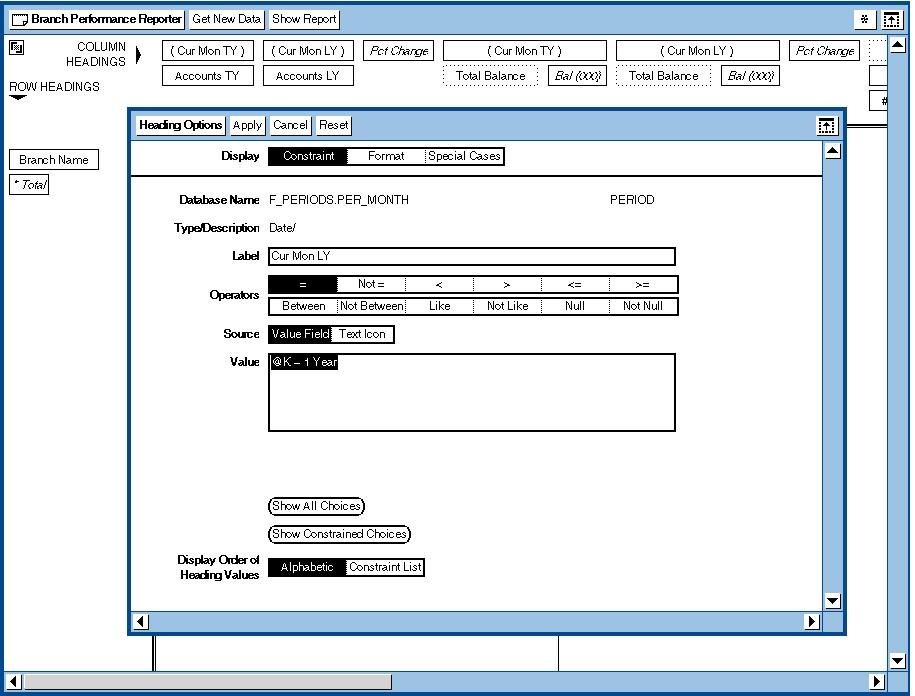
For the second image you can see that the period is constrained by “@K – 1 Year”. The “-1 Year” is enough to tell Meta5 to constrain the data for this month last year.
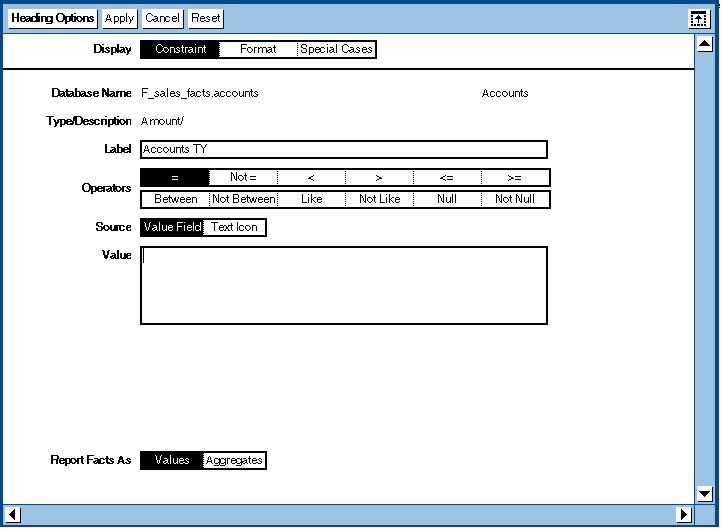
For the third image you can see that the number of accounts will be retrieved from the sales facts table.
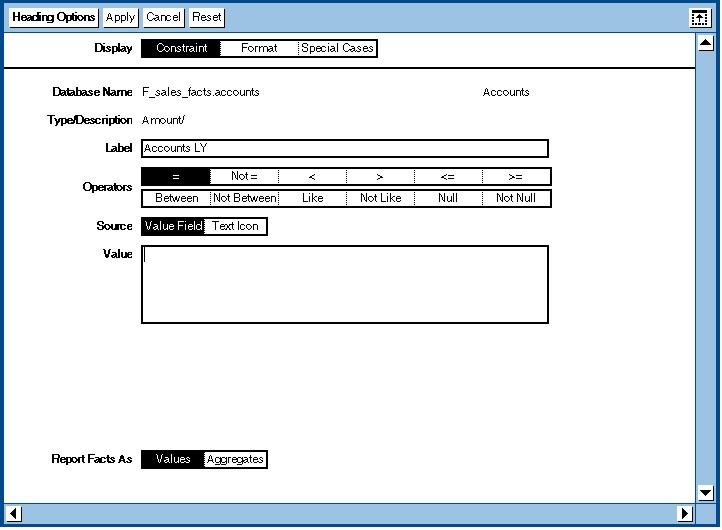
For the fourth image you can again see that the number of accounts will be retrieved. However, because of it’s positioning on the report this sum of number of accounts will be for the “@K – 1 Year” month. Meaning the number of accounts in this month last year.
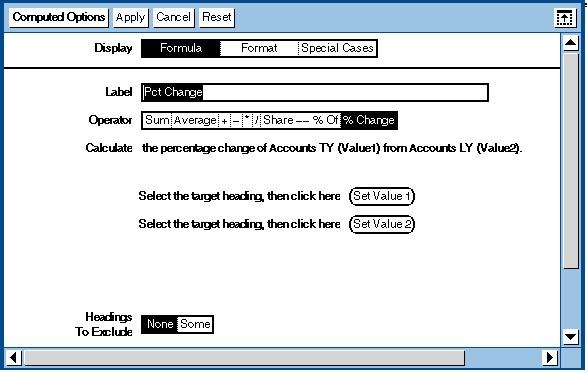
For the fifth image you can see that you can apply a formula to the columns and you can calculate a variety of things such as Sum, Average, % Share of, % Change. You can see that the formula that is going to be executed is the Accounts This Year from Accounts Last Year as a % Change.
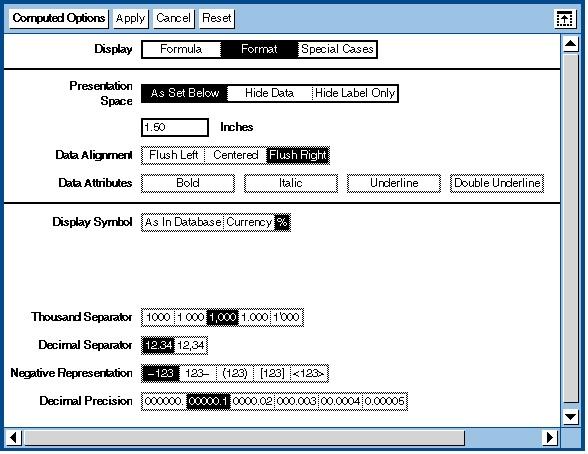
Lastly, for the sixth image you can see that we have formatting options for the Percentage Change calculation.
The SQL that is Generated by Reporter
Of course, the report is quite a wide report and there are many fields. We can not take you though each field and show you the options in a simple blog post. What we can do is show you the generated SQL. You may or may not know what SQL is. It is the language that databases understand. Your DBAs can tell you a bit about it if you like. We are going to show you the SQL that was executed to generate the report. And remember, you do not need to know anything about SQL or databases to be able to do this. We are showing you the SQL so that you have a better understanding of what the tool is doing when it actually runs.
Get the names of the Branches in order.
select distinct F_MARKET.BRNAME

from F_MARKET

where (F_MARKET.DETAIL = 'Branch')

order by 1
Get the names of the month where the date is ‘2015-03-01’.
select distinct F_PERIODS.PER_MONTH

from F_PERIODS

where (F_PERIODS.PER_MONTH = '2015-03-01')

order by 1
Get the names of the month where the date is ‘2014-03-01’. This is this month last year.
select distinct F_PERIODS.PER_MONTH

from F_PERIODS

where (F_PERIODS.PER_MONTH = '2014-03-01')

order by 1
Get the names of the Year where the year is set to 2015.
select distinct F_PERIODS.YEAR

from F_PERIODS

where (F_PERIODS.YEAR = 2015)

order by 1
Get the names of the Year, Month where the month is less than ‘2015-03-01’ year is set to 2015. This is setting up the year to date fields.
select distinct F_PERIODS.YEAR,F_PERIODS.PER_MONTH

from F_PERIODS

where (F_PERIODS.PER_MONTH <= '2015-03-01')

AND (F_PERIODS.YEAR = 2015)

order by 1, 2
Get the Year when the Year is 2015-1. This is selecting Last Year.
select distinct F_PERIODS.YEAR

from F_PERIODS

where (F_PERIODS.YEAR = 2015-1)

order by 1
Get the Year and Month where the month is less than ‘2014-03-01’ and the year is 2015-1 meaning 2014. This is getting the months from last year for the year to date.
select distinct F_PERIODS.YEAR,F_PERIODS.PER_MONTH

from F_PERIODS

where (F_PERIODS.PER_MONTH <= '2014-03-01')

AND (F_PERIODS.YEAR = 2015-1)

order by 1, 2
Some of the above SQL is issued a number of times to set up the cells to put the data in to.
The next set of statements actually retrieve the data to the reporter tool and then the reporter tool performs calculations on those cells.
Get the Branch and the month and the number of accounts for the month starting 2015-03-01.
select

F_MARKET.BRNAME

,F_PERIODS.PER_MONTH

,F_sales_facts.accounts

from F_PERIODS,F_MARKET,F_PRODUCTS,F_sales_facts

where F_PRODUCTS.PSNUM=F_sales_facts.PSNUM

and F_PERIODS.PER_MONTH=F_sales_facts.PER_MONTH

and F_sales_facts.BRANCH=F_MARKET.BRANCH

and (F_PERIODS.PER_MONTH = '2015-03-01')

AND (F_MARKET.DETAIL = 'Branch')

AND (F_PRODUCTS.DETAIL = 'Total')

AND (F_sales_facts.PER_MONTH = '2015-03-01')

order by 1, 2
Get the Branch and the month and the number of accounts for the month starting 2014-03-01. Namely this month last year.
select

F_MARKET.BRNAME

,F_PERIODS.PER_MONTH

,F_sales_facts.accounts

from F_PERIODS,F_MARKET,F_PRODUCTS,F_sales_facts

where F_PRODUCTS.PSNUM=F_sales_facts.PSNUM

and F_PERIODS.PER_MONTH=F_sales_facts.PER_MONTH

and F_sales_facts.BRANCH=F_MARKET.BRANCH

and (F_PERIODS.PER_MONTH = '2014-03-01')

AND (F_MARKET.DETAIL = 'Branch')

AND (F_PRODUCTS.DETAIL = 'Total')

AND (F_sales_facts.PER_MONTH = '2014-03-01')

order by 1, 2
Get the Branch and the month and the balances of accounts for the month starting 2015-03-01.
select

F_MARKET.BRNAME

,F_PERIODS.PER_MONTH

,F_sales_facts.balance

from F_PERIODS,F_MARKET,F_PRODUCTS,F_sales_facts

where F_PRODUCTS.PSNUM=F_sales_facts.PSNUM

and F_PERIODS.PER_MONTH=F_sales_facts.PER_MONTH

and F_sales_facts.BRANCH=F_MARKET.BRANCH

and (F_PERIODS.PER_MONTH = '2015-03-01')

AND (F_MARKET.DETAIL = 'Branch')

AND (F_PRODUCTS.DETAIL = 'Total')

AND (F_sales_facts.PER_MONTH = '2015-03-01')

order by 1, 2
Get the Branch and the month and the balances of accounts for the month starting 2014-03-01. Namely this month last year.
select

F_MARKET.BRNAME

,F_PERIODS.PER_MONTH

,F_sales_facts.balance

from F_PERIODS,F_MARKET,F_PRODUCTS,F_sales_facts

where F_PRODUCTS.PSNUM=F_sales_facts.PSNUM

and F_PERIODS.PER_MONTH=F_sales_facts.PER_MONTH

and F_sales_facts.BRANCH=F_MARKET.BRANCH

and (F_PERIODS.PER_MONTH = '2014-03-01')

AND (F_MARKET.DETAIL = 'Branch')

AND (F_PRODUCTS.DETAIL = 'Total')

AND (F_sales_facts.PER_MONTH = '2014-03-01')

order by 1, 2
Get the Branch and the year and the month and the number of accounts for the Year to Date.
select

F_MARKET.BRNAME

,F_PERIODS.YEAR

,F_PERIODS.PER_MONTH

,F_sales_facts.accounts

from F_PERIODS,F_MARKET,F_PRODUCTS,F_sales_facts

where F_PRODUCTS.PSNUM=F_sales_facts.PSNUM

and F_PERIODS.PER_MONTH=F_sales_facts.PER_MONTH

and F_sales_facts.BRANCH=F_MARKET.BRANCH

and (F_PERIODS.YEAR = 2015)

AND (F_PERIODS.PER_MONTH <= '2015-03-01')

AND (F_MARKET.DETAIL = 'Branch')

AND (F_PRODUCTS.DETAIL = 'Total')

AND (F_sales_facts.PER_MONTH <= '2015-03-01')

order by 1, 2, 3
Get the Branch and the year and the month and the number of accounts for the Last Year to Date.
select

F_MARKET.BRNAME

,F_PERIODS.YEAR

,F_PERIODS.PER_MONTH

,F_sales_facts.accounts

from F_PERIODS,F_MARKET,F_PRODUCTS,F_sales_facts

where F_PRODUCTS.PSNUM=F_sales_facts.PSNUM

and F_PERIODS.PER_MONTH=F_sales_facts.PER_MONTH

and F_sales_facts.BRANCH=F_MARKET.BRANCH

and (F_PERIODS.YEAR = 2015-1)

AND (F_PERIODS.PER_MONTH <= '2014-03-01')

AND (F_MARKET.DETAIL = 'Branch')

AND (F_PRODUCTS.DETAIL = 'Total')

AND (F_sales_facts.PER_MONTH <= '2014-03-01')

order by 1, 2, 3
Get the Branch and the year and the month and the balances of accounts for the Year to Date.
select

F_MARKET.BRNAME

,F_PERIODS.YEAR

,F_PERIODS.PER_MONTH

,F_sales_facts.balance

from F_PERIODS,F_MARKET,F_PRODUCTS,F_sales_facts

where F_PRODUCTS.PSNUM=F_sales_facts.PSNUM

and F_PERIODS.PER_MONTH=F_sales_facts.PER_MONTH

and F_sales_facts.BRANCH=F_MARKET.BRANCH

and (F_PERIODS.YEAR = 2015)

AND (F_PERIODS.PER_MONTH <= '2015-03-01')

AND (F_MARKET.DETAIL = 'Branch')

AND (F_PRODUCTS.DETAIL = 'Total')

AND (F_sales_facts.PER_MONTH <= '2015-03-01')

order by 1, 2, 3
Get the Branch and the year and the month and the balances of accounts for the Last Year Period to Date.
select

F_MARKET.BRNAME

,F_PERIODS.YEAR

,F_PERIODS.PER_MONTH

,F_sales_facts.balance

from F_PERIODS,F_MARKET,F_PRODUCTS,F_sales_facts

where F_PRODUCTS.PSNUM=F_sales_facts.PSNUM

and F_PERIODS.PER_MONTH=F_sales_facts.PER_MONTH

and F_sales_facts.BRANCH=F_MARKET.BRANCH

and (F_PERIODS.YEAR = 2015- 1)

AND (F_PERIODS.PER_MONTH <= '2014-03-01')

AND (F_MARKET.DETAIL = 'Branch')

AND (F_PRODUCTS.DETAIL = 'Total')

AND (F_sales_facts.PER_MONTH <= '2014-03-01')

order by 1, 2, 3
Summary
This blog entry has been much longer than our normal blog entries. However, the Reporter Tool is our most sophisticated data access and reporting tool so you can see how this blog entry needed to be longer.
The reporter tool was designed from the ground up to understand and bind closely to dimensional data warehouses. It is the perfect query tool for dimensional data warehouses. We would argue it is the best query tool for star schema data warehouses. Especially because when it returns its data it can then forward it to many of the other 120+ tools that can be used to further process the data.
The data from the Reporter tool can be sent directly to tools like Excel or Word even further enhancing the power of the Reporter Tool by linking it directly to the world most popular spreadsheet and graphics tool, Excel.
If you would like to learn more about the Reporter tool and why it is the best query tool for star schema data warehouses we will soon be posting a demonstration video. In the meantime you can always order a copy of the manual from sales@meta5.com.
Do you have a star-schema data warehouse? Then the reporter tool is the tool you need to get the data from your star schema data warehouse to your excel spreadsheet without the problems usually associated with Excel!
The Reporter tool is the perfect companion for your star schema data warehouse and Excel.
Meta5: The Better Way
Thank you for your time and attention.
Leave a Reply