Products
If you are one of the many overworked “power data analysts” who spend most of your day trying to answer difficult and complex ad hoc requests; If you are frustrated in getting your job done with the tools you have at hand; If you read our home page and said “that’s me” – We have good news for you!
We have the only Data Analysis Desktop designed for the power data analyst. If your job is to answer the most difficult and complex of ad hoc questions that may have a significant impact on the profitability of your company, we have what you need: Meta5.
Your job will be about answering the question, “Why,” and “What if we did something different in our business?”
The management decision-making process that you are a part of flows in a never ending cycle, as depicted in the diagram below.
Management Decision Making Process
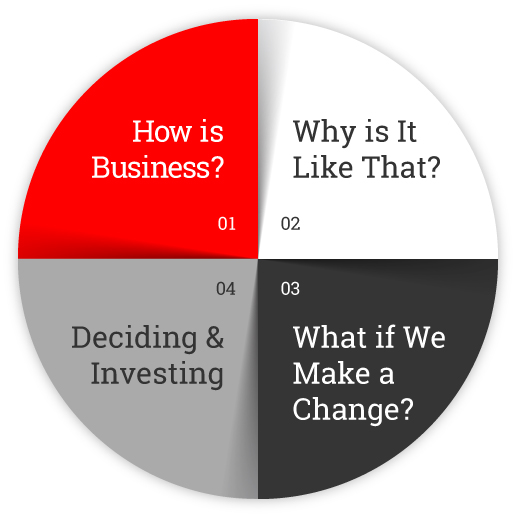
“How’s Business” is the world of dashboards, reports, spreadsheets and other tools. These tools often use red, amber, or green charts or similar graphical methods to highlight out of plan situations.
Your company will have many such dashboards or reports. However, when an indicator turns red, or even green, the very next question that occurs is “Why is it like that?”
The power data analyst is the person who answers this question the vast majority of the time. Once you establish a reasonable hypothesis, test it, and find it to be very likely true, or even known to be true. The next question that occurs is “What if we do something different?” “What if we make a change?”
It is the job of the power analyst to perform such “what-if” analysis and to present the various alternatives back to senior management, so they can make their decision based on your analysis, recommendations and business cases.
The management team must make a decision. They may do nothing. They may decide to invest time, effort and money into a new initiative to alter the business in some way. It may be a big decision. It may be a small decision. This decision and investment of effort naturally leads to the question of “How did our decision turn out?” meaning “How is business”?
This is, essentially, the management decision making process. It is endless. As long as the company is in business managers will go through this cycle. All the reports and dashboards in the world are useless without you, the power data analyst, to answer the questions “Why?” and “What if?”
The speed at which a company can go around this cycle has another name. It is called “competitive advantage”. The company that can make decisions, especially big decisions, faster than their competition, with greater confidence and with better results, wins.
Having the tools to help you get around this cycle faster is a significant competitive advantage.
Meta5 was designed from the ground up to give you all the tools you need to be able to answer these complex, complicated, one off, ad hoc questions. These questions often come up when something goes out of plan. They also come up when you have a “bright idea” or someone else has a bright idea and they ask “what if we did this? How might that work out?”
If you are frustrated with the tools you have available to answer this style of question; if you think there must be a better way – we have good news for you.
Meta5: The better way.
We believe the reason that so many power data analysts are frustrated, and struggle to get the results they need as fast as demanded using the tools they are given is because of the conflicting nature of today’s software design paradigm.
We build software to be:
1. Easy to use
2. Have high levels of functionality.
Meta5 takes a radically different approach. An approach that was designed for power data analysts. We believe it is a better approach.
We use a simple iconic programmable interface that power data analysts can learn quickly and easily. A run through the demo, a quick flip through the relevant manual, and away you go! Simple. Fast. Easy.
We provide you with over 120 tools in a fully integrated Data Analysis Desktop. With this you can get your job done about 5 times faster than using other tools on the marketplace.
This is what a simple capsule might look like. You can build capsules with hundreds of icons with the greatest of ease. Notice how easy it is to understand.
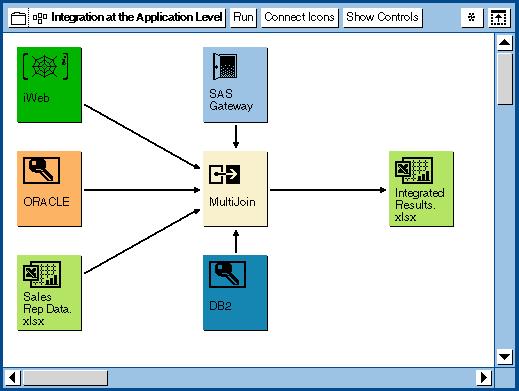
This capsule draws data from SAS, a web page, Oracle, a spreadsheet and DB2. It joins it all together and puts it in to one finished spreadsheet. This is how easy it is to integrate date in Meta5.
In business, time is money. If you could be 5 times more productive, then you get a competitive advantage for your company.
This is the promise of Meta5. It is the promise that we can make you 5 times more productive. Meta5 will empower you to get the job done in a fraction of the time. Meta5 makes the impossible routine.
Take the tour. Watch the demos. Look at what the Data Analysis Desktop of the future looks like.
Meta5: Fastest time to answer the next big question.
Want to know more? Call us on 866-META555.