Excel. The very mention of it drives some IT people crazy! IT people have been making up less than glowing names for sets of Excel spreadsheets for a while now.
We heave all heard:
- Excel Hell – Referring to widespread use of Excel in a company.
- Spreadmarts – Referring to building reporting systems based on Excel.
- Sneakernet – Referring to how spreadsheets get mailed around between people and data extracted and re-entered. Email being one step up from the days these spreadsheets were carried around on disks by people wearing “sneakers”.
While it is fair to say that there are weaknesses with Excel because of macros and links, it is also fair to say that most Power Data Analysts can get the work they need to get done much faster in Excel than they can by calling IT and getting IT to develop what the business needs. Even today, we continue to see the “gap” between Business and IT.
Meta5 is uniquely able to help bridge that gap in many areas. And one of the most important areas is the use of Excel. We do excel integration better than Microsoft does Excel integration.
The vast majority of end users would prefer their reports to be delivered in Excel. They know Excel. They love Excel. They use it every day. So they ask “Why can we not deliver all our reports in Excel”?
Of course the problems with Excel are links and macros. People build “Excel Reporting Systems” and link Excel workbooks so frequently that in the end the linkages become fragile. No one really knows what changing one of the thousands of spreadsheets might do to the other spreadsheets.
We at Meta5 have solved the two sides of this problem so that Excel can be used as the delivery mechanism for those reports that are suitable to be delivered via Excel.
The first side of the problem that the Meta5 system addresses is that it makes it trivial to get data from a relational database directly into an Excel spreadsheet because we control the placement of the data into the Excel spreadsheet via our own APIs.
The second side of the problem that the Meta5 addresses is that the data integration from all the components is performed inside the self documenting visual programming environment of the Meta5 system and only the final results are sent to the Excel workbooks. This means that there is no need to link Excel workbooks using the Excel links which is the source of the “Excel spreadmarts” and the “Excel hell” of fragile links.
The Meta5 system can send data into any number of named regions in a target Excel workbook and the Excel workbook can contain charts and drills for the resultant data that has been sent into it. This means that the most complex and sophisticated workbooks can be developed and the data can be delivered into the Excel workbook via the Meta5 system.
The Meta5 system can execute capsules repetitively to generate Excel workbooks for various business subject areas such as product lines and then place those Excel workbooks into any location that the Power Data Analyst desires including as email attachments or reporting portals.
In short, every other major BI Reporting Tool vendor has been spending their development money on emulating the features of Excel so that their users can more easily adapt to the “look and feel” of their tools. We at Meta5 took the unique and different approach of delivering the data to Excel in such a way as to remove the problems and issues related to using Excel as the delivery tool for graphical reports.
The Meta5 system has similar integration capability for Word so that if a report is more text based than graphical based the output for the report can also be a Word document.
By taking advantage of the ubiquitous nature of Microsoft Office and making Office one of the main ways that reports built in Meta5 can be delivered the Meta5 system itself becomes very much a “black box” to the vast majority of people who might consume the reports generated by the Meta5 system.
In any large organization a small group of Power Data Analysts who are true experts in the business and expert users of Meta5 can easily build and support analytical applications that can deliver their results to the “masses” of users via the ubiquitous Office products and similar compatible products. In such cases end users do not need to learn a “slightly different look and feel” for the reporting system because they will be getting their reports in Excel, Word or PDFs generated out of such tools.
In these cases the Meta5 system becomes the “engine room” of the generation of reports that are delivered by every day familiar tools. The investment in Office, both software and skills, is leveraged. There is no need to be buying large numbers of end user licenses for “BI Tools” as is the case today. All the vendors are selling BI Tools where they require some form of “per user” or “capacity” licensing so that they can derive more revenue from their clients for the more seats of the BI Tool that are deployed.
The following diagrams demonstrates how Excel integration happens inside the Meta5 system.
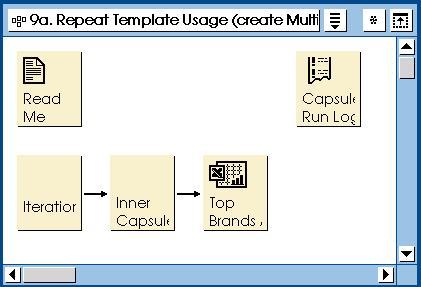
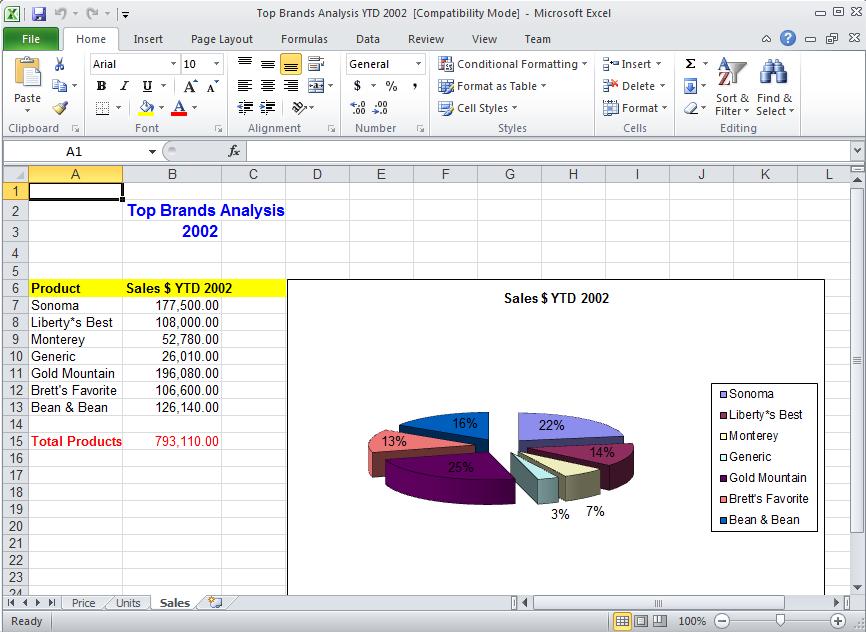
The outer capsule is the “9a Repeat Template Usage, create Multiple Sheets”. In this example the output of the capsule will be an Excel workbook with three worksheets. Price, Units, Sales.
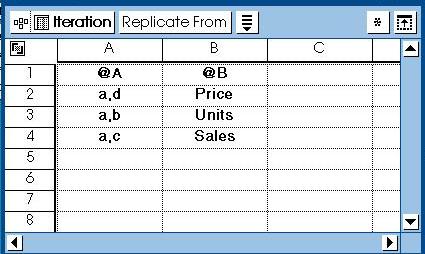
The spreadsheet “Iteration” sets the variables @A and @B to be as you can see. “a,d”, “a,b”, “a,c”. Price, Unit, Sales. These variables are passed into the “Inner Capsule” which will select data from the “Top Brands” spreadsheet to create the three worksheets.
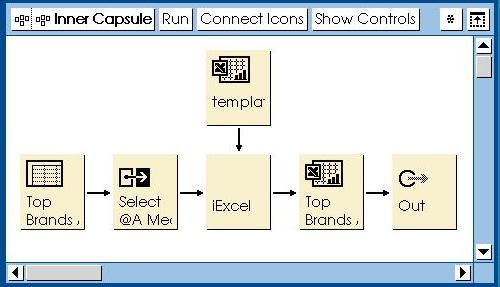
The “iExcel” icon will manipulate the data flow to create an Excel workbook based on the “Template” Excel workbook that has three sheets. It will then send the workbook with the three sheets to the “Out” icon so that the data can flow out of the capsule to the outer Excel workbook.
Of course the outer Excel workbook could be posted to a portal or emailed to users.
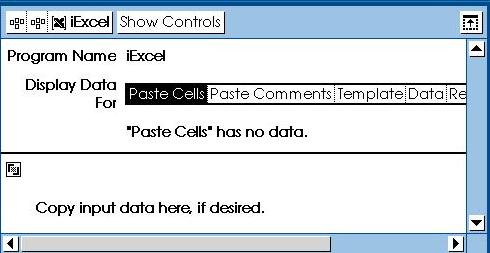
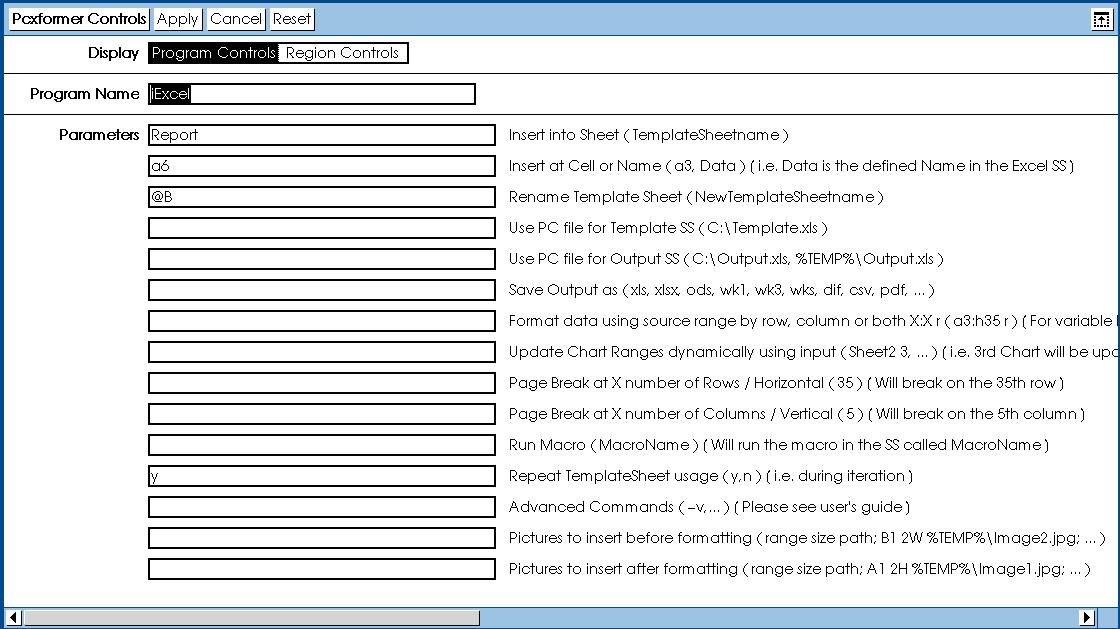
To understand how the Excel integration is achieved in the iExcel icon you can open up the controls and read what controls are available. These controls are used to interface with the Excel APIs to send the data into the workbook and to render the charts. It is even possible to define the type of output desired such as pdfs.
Notice that the third parameter is the “Rename Template Sheet” option and it is set to @B. This means the sheet will be renamed to Price, Unit, Sales as per the iteration spreadsheet that is driving the inner capsule. Naturally it is possible to create as many worksheets as Excel supports.
And, of course, we just have to show you the finished Excel workbook. What we want to emphasis is that as long as it is possible to present the data in an Excel workbook we are able to gather up the data via the Data Analysis Desktop using the unique capsule capability to prepare and present any data possible to be presented in an Excel workbook.
No one else can do this. Not even Microsoft.
Meta5: Better Excel Integration than Microsoft
Meta5: The Better Way
Thank you for your time and attention.
Leave a Reply