
Hello and Welcome to our latest Blog post.
Thank you very much for dropping by, we really appreciate you!
Today we are going to cover in some detail how Meta5 can be used to create what we have nicknamed “Excel Data Mart Dashboards”.
We all know Excel 365 is taking the world by storm and the number of Excel users just grows and grows. For all intents and purposes Excel is now pervasive in Business and it is making rapid entry in to the home.
As much as people love other BI tools? Excel is the worlds Number 1 end user BI tool and there is daylight second. Excel is pervasive and everyone who wants a dashboard has access to Excel.
The issue with Excel is that to build a dashboard in Excel you need to link it to a product that speaks MDX and you need to store your data on some centralized server for all the Excel dashboards to get their data from.
This blog post is about how we at Meta5 have a viable alternative to SSAS as the place in which to store data for excel dashboards.
If you would like to get a headstart on the blog post and download a detailed white paper on how to build Excel Dashboards using Meta5 first? Please click on the button below:
The Current Situation
As mentioned in the Introduction, Excel is now pervasive in business. Excel 365 is making inroads in to the home environment. It is pretty much the case that “everyone” knows and loves Excel, and if they don’t then they can learn it very quickly.
Some people argue that the user base of Excel is now approaching ONE BILLION PEOPLE!
So what is the “normal” approach for building a dashboard in Excel today?
Well, we have all the usual portions of the data warehousing environment.
- Extraction from source systems.
- Movement to the Staging Area
- Movement to the Data Warehouse
- Movement to the SSAS Cubes (and more recently tables)
- And finally connection to Excel and presentation via pivot tables.
This can be represented by this very simple diagram.
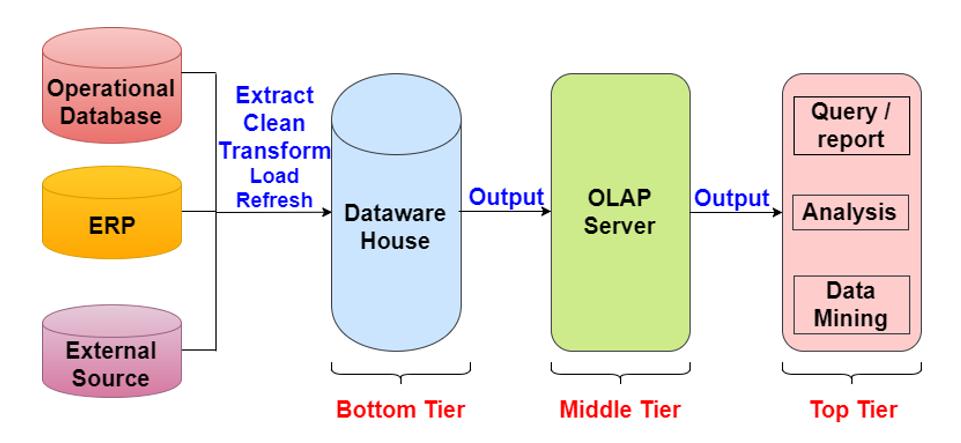
The last two steps are the steps we are interested in.
To be able to build a dashboard in Excel you must access the data via pivot tables using some form of OLAP server. The vast majority of Excel users who build dashboards use SSAS cubes as their OLAP server.
We are aware of products like AtScale that can emulate an SSAS Cube back in to a star schema database. We will just not discuss them in detail here.
Please note: We are also aware MicroSoft plans to “end of life” SSAS Cubes in favor of the new table model. When we say SSAS “Cubes” we mean “Cubes and Tables”.
What are the issues with building SSAS Cubes?
SSAS Cubes:
- Take quite a significant amount of time to develop and to maintain.
- Take high level (expensive) skills to maintain.
- Require the Excel Dashboards to make round trips to the SSAS Server for each click on a slicer.
- Require interactive selection of data for the subset of data being sent back to the Dashboard.
- Require movement of data from the data warehouse to the Cubes using such tools as SSIS which increases the ETL development and support time, effort and costs.
However, because Excel users have so loved their cubes for so long and SSAS has been the best way to support Excel users, today we have millions of Excel users using SSAS Cubes for their reports and dashboards.
Many of those companies are paying more money than they need to pay for the benefit of the reports and dashboards they are using.
There is a better way, the Meta5 way.
What is Different about Meta5?
Two of the most expensive portions of supporting Excel Dashboards and reports in Excel are:
- Supporting the development, support and maintenance of the cubes.
- Supporting the ETL and then query processing for what is a separate store of data.
There is also the issue that the Excel Dashboard has to be connected to the SSAS Server to retrieve data for the workbook when slicers are clicked.
With Meta5 we are proposing an alternative to this implementation.
It will not be suitable for companies that need millions of rows exposed in their pivot tables for their Excel workbooks.
However, the vast majority of Excel Dashboards and reports contain just a few thousand, or tens of thousands, of rows in the “summary fact tables” that are used for the dashboards.
With Meta5 we are proposing to use the Meta5 tools to select data from where ever it may reside and sending it in to the Excel Power Query data model and then basing the Dashboard on the Excel Power Query model inside the Excel workbook.
The big difference is that with Meta5 we can run what are called “capsules”.
These “capsules” can be parameterized and can create customized Excel dashboards per user of the dashboard.
Let me give you a real world example.
Let us say that we have a retailer who uses Microsoft Navision and LS Retail, a very common combination in retailers. The retailer has 200 stores. They have 10 region managers who are responsible for 20 stores each.
The usual approach to Excel Dashboards would be to place data in to SSAS Cubes and the Region Managers would have Excel Dashboards that would be the same for each Region Manager.
It would have a slicer called “Region Manager” and s/he would select their own name from the slicer.
Then the Excel Dashboard would go back to the SSAS Cubes in the centralized server and get the data for that Region Manager. It would then pass the data to the pivot tables in Excel and build the Dashboard for each click on the dashboard. There are thousands of Navision / AX installed customers doing exactly this today.
But is that the only way this can be done?
It is the cheapest way this can be done?
We believe “no” is the answer to both those questions.
With Meta5 it is possible to build “capsules” that can be run repetitively using the Region Manager as a parameter. The data for each region manager can be read directly from the data warehouse during ETL process and sent in to a customized Excel workbook in to the Power Query model.
This customized workbook can then be sent to where the Region Manager wishes to consume the Excel Dashboard. This can be to a corporate shared drive, a one-drive, or his/her PC/Laptop/Tablet.
Because the workbook only contains the data required by the Region Manager the volumes of data being sent in to Excel workbooks is much smaller than having one workbook for all 10 Region Managers.
Because the workbook contains the data there is no “round trip” to any centralized database for each click of a slicer. Each click of the slice operates on the data inside the Power Query Model inside the workbook that is local.
We have nicknamed this idea of sending data in to the PowerQuery Model inside the Excel Workbook to be the “Excel Data Mart Dashboard”. Essentially we are sending a tiny “Data Mart” in to the Excel workbook and then allowing the Excel workbook to use that tiny “data mart” to respond to slicer clicks.
Meta5 allows these “capsules” to be scheduled as part of the daily ETL process so that when the data warehouse is updated the Excel “Data Mart Dashboards” get refreshed from the data warehouse and are then sent to the locations where they will be consumed.
As we mentioned, this is only suitable where the “Excel Data Mart Dashboard” consumer has a device with the processing power needed to load the model and query the model. We are in no way saying that Meta5 is the ONLY way that such dashboards can be created. Obviously there are millions of users using SSAS as their source for their Excel dashboards.
What we are saying is that hundreds of thousands of Excel Dashboards installed and being used today could be converted to use Meta5 and supported at lower ongoing costs. We are saying that new dashboards being built could well be faster, cheaper and easier to build and support using Meta5 than building new cubes in SSAS.
Another great advantage of Meta5 is that it is a kind of “end user ETL tool” as well.
That is not it’s primary purpose, however, Meta5 is capable or reading a very wide array of data sources.
It can perform all sorts of cleaning and analysis functions, and it can send the results in to an Excel workbook as finished “mini fact tables” that can then be exposed via Power Pivot.
What this means is that if you need some data that has not yet been put into the Data Warehouse, you don’t have to wait on your IT team to put the data in to the data warehouse and make it available to get it into your dashboard.
What is now called “data wrangling” has long been available for meta5 users.
In this way you can include new data in your dashboards and reports even if that data is not in the data warehouse yet. And that data can come from almost anywhere.
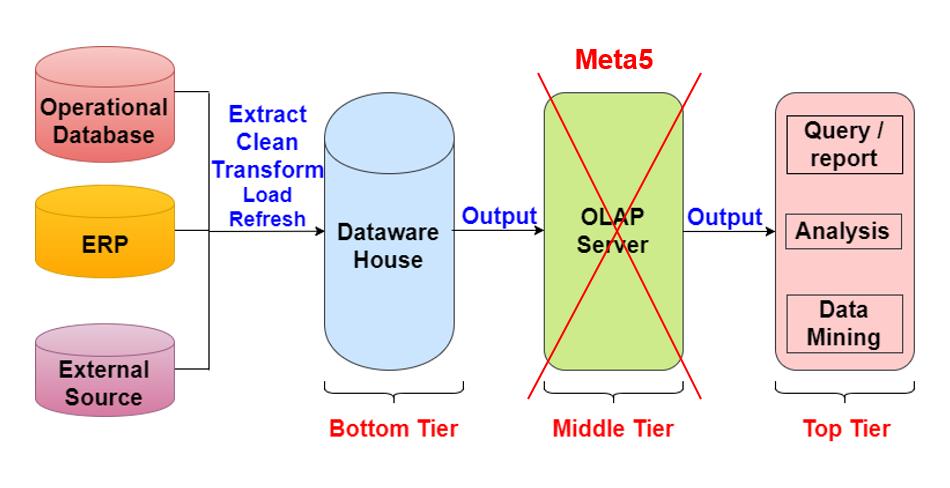
If we were to consider the simple diagram above? What we are proposing with Meta5 is to replace the OLAP server, usually SSAS, with Meta5 Enterprise Edition to service the construction of all the Excel Dashboards and reports required across your organization.
Summary
In summary, there is an “accepted standard” today for how Excel Dashboards are built. The data is placed in to SSAS Cubes and Excel accesses these cubes via the power pivot models and the MDX language.
This use of SSAS has a cost profile which is significant because of:
- The time and effort that is required to design and support the SSAS Cubes.
- The ETL run time to populate the cubes every day.
- The extra storage and processing that is required to support the SSAS Cubes.
There are millions of users of such Excel reports and dashboards using SSAS Cubes in this manner.
Every day more reports and dashboards are being built using this standard approach.
There is a better way, the Meta5 way.
With Meta5 there is no need for the SSAS Cube layer.
Data can be retrieved directly from the data warehouse, and almost anywhere else, and placed directly in to the Excel Power Query Model inside and Excel Workbook.
The Dashboards and slicers in the workbook can then operate on the Power Query model inside the workbook where the business user consumes the workbook. On his/her PC, Laptop or Tablet.
The workbooks can be customized to the individual business user they are going to be sent to in terms of the data sent in to the Power Query model so that the workbooks are smaller and more responsive.
You can produce many such customized workbooks during the ETL processing and send them to where ever the users wish to consume them.
This approach is better, cheaper, faster and will result in significant cost savings for those companies that adopt this way of creating Excel Reports and Dashboards.
These are the cases where the volumes of data in the Dashboards are low enough that an Excel workbook can reasonably perform such processing.
We have released a detailed white paper for an example workbook, and for those who are interested we can provide a copy of the sample capsule and a sample workbook so that you can study them in depth at your convenience.
We are well aware that most companies have better Excel users than we do here at Meta5 so you are welcome to download a demo version of Meta5 and try this out for your selves.
We are very excited about helping your save your money in building your Excel Reports and Dashboards in the future. If you have any questions please put them in the comments below or contact us directly on the contacts page.
If you would like to download a detailed white paper on how to build Excel Dashboards using Meta5.
Please click on the button below:
If you would like to download an actual example of our first Excel Dashboard using Meta5.
Please click on the button below:
Meta5: The Better Way
Thank you for your time and attention
Jim Kanzler.
Leave a Reply